skip to main content

Fund Overview: Objective, Strategy and Holdings

  • The International Equity Fund seeks to earn long-term capital appreciation primarily from a broadly diversified portfolio of foreign equities.
  • The Fund holds real estate investment trusts (REITs) and interests in private real estate and private equity partnerships located in foreign countries.
  • The Fund generally does not invest in companies that derive more than 10% of their revenue from gambling or from the manufacture, sale or distribution of alcoholic beverages, tobacco-related products, adult entertainment, weapons, or the management or operation of prison facilities.

Fund Managers

The following individuals are responsible for the selection and monitoring of external asset managers:

Frank Holsteen Image

Frank Holsteen

Managing Director, Investment Management

  • With Wespath since 2012
  • B.A. from Lake Forest College
Amy Bulger Image

Amy Bulger

Director, Private Markets

  • With Wespath since 2013
  • B.S. from Northern Illinois University
  • MBA from the Kellstadt Graduate School of Business at DePaul University

Management

The Fund invests with strategies that include developed markets, emerging markets and international small-cap. The approach primarily uses active management to invest fund assets among different countries and/or regions of the world. The Fund's managers seek to invest in attractively valued companies that represent long-term above-average investment opportunities.

External Asset Managers

* Signatory to the United Nations Principles for Responsible Investment


Please refer to the Investment Funds Description – P Series for a detailed description of the investment strategies used in managing the Fund.

Fund Performance 1,2,3, Net-of-Fees (as of 12/31/2023)

  3 mo YTD 1 yr 3 yr 5 yr 10 yr
International Equity Fund 8.88% 11.97% 11.97% -2.65% 6.70% 3.80%
IEF Benchmark 9.81% 15.62% 15.62% 1.53% 7.18% 3.97%

Universe Comparison

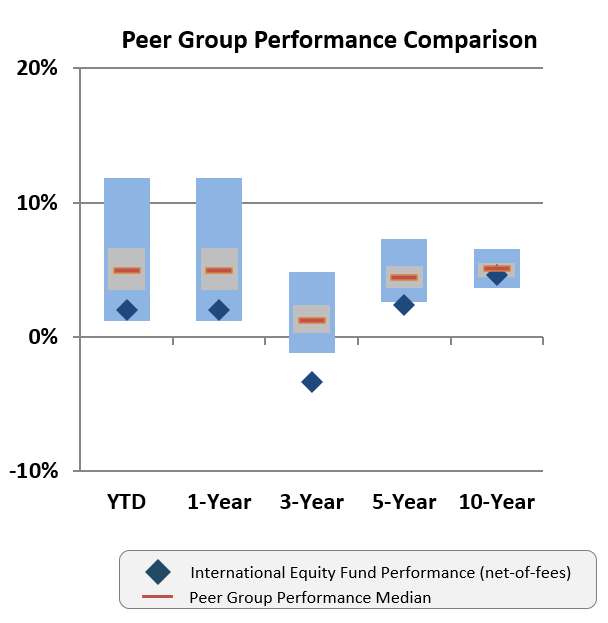
International Equity Fund vs. Peer Group Universe

Peer Group Performance Comparison

Peer group performance comparison

Annualized Performance (Net-of-Fees)

  1 Year 3 Year 5 Year 10 Year
International Equity Fund 12.0% -2.6% 6.7% 3.8%
Median 16.4% 2.5% 7.3% 4.0%
Rank (%) in Universe 96th 98th 74th 60th
# of Observations 294 275 252 155


Peer Group Performance Comparison and Annualized Performance (Net-of-Fees) data as of December 31, 2023.

Source: Lipper. Lipper International Equity Funds Universe is a group of mutual funds comparable to IEF. Lipper utilized all mutual funds included in the pre-defined Lipper classification universes of "Int'l Multi-Cap Core" to construct this Universe.


Footnotes

Wespath Benefits and Investments (“Wespath”) is a general agency of The United Methodist Church, a 501(c)(3) tax-exempt organization. Wespath administers benefit plans and together with its subsidiaries, UMC Benefit Board, Inc. (“UMCBB”) and Wespath Institutional Investments LLC (“WII”) invests (or provides back-office services for) assets on behalf of benefit plan participants and beneficiaries, plan sponsors and other institutions controlled by, affiliated with or related to The United Methodist Church (the “Church”). For GIPS compliance purposes, the Firm referenced herein is defined to include Wespath, UMCBB and WII (“Firm”).

Wespath claims compliance with the Global Investment Performance Standards (GIPS®). GIPS is a registered trademark of CFA Institute. CFA Institute does not endorse or promote this organization, nor does it warrant the accuracy or quality of the content contained herein. To obtain a copy of Wespath’s GIPS Report, please call us at 1-847-866-4100 or e-mail us at [email protected].

1 The performance shown is for the stated time period only, is computed in U.S. Dollars (USD) and reflects time‐weighted returns. Historical returns are not indicative of future performance. Investment performance is presented net-of-fees. See Risks and Disclosures for more information regarding fees, including how fees are reflected in performance. The investments of the Fund may vary substantially from those in the applicable benchmark. Benchmarks are based on broad-based securities market indices, which are unmanaged, cannot be invested in and are not subject to fees and expenses typically associated with investment funds. Investments cannot be made directly in an index. The bar chart and tables were produced using data from sources believed to be accurate. The bar chart and tables assume reinvestment of dividends, interest and other distributions. This information is for informational purposes only and is not an offer to purchase securities.

2 Please refer to the Investment Funds Description – P Series for more information about the Fund. The investment funds are neither insured nor guaranteed by the government.

3 Benchmark descriptions can be found here.

Allocations

Holdings-Based Regional Allocations as of December 31, 2023
Region IEF Actual(%) IEF Benchmark (%) Difference(%)
Europe (ex-United Kingdom) 26.9% 31.0% -4.1%
Emerging Markets 22.9% 27.2% -4.3%
Japan 10.0% 15.5% -5.5%
United Kingdom 8.5% 9.5% -1.0%
Pacific (ex-Japan) 7.6% 8.3% -0.7%
North America 9.7% 7.8% +1.9%
Africa/Mideast 0.5% 0.6% -0.1%
Frontier 2.2% 0.0% +2.2%
Cash (equitized) 1.5% 0.0% +1.5%
Other 0.0% 0.0% +0.0%
Alts 10.2% 0.0% +10.2%


Holdings-Based Sector/Industry Allocations as of December 31, 2023
Sector/Industry IEF Actual (%) IEF Benchmark (%) Difference(%)
Communication Services 3.6% 5.0% -1.4%
Consumer Discretionary 11.3% 11.5% -0.2%
Consumer Staples 5.0% 7.8% -2.8%
Energy 3.1% 5.4% -2.3%
Financials 13.9% 19.8% -5.9%
Health Care 8.0% 9.0% -1.0%
Industrials 15.2% 14.5% +0.7%
Information Technology 13.3% 12.3% +1.0%
Materials 6.7% 8.5% -1.8%
Real Estate 1.9% 3.1% -1.2%
Utilities 2.4% 3.2% -0.8%
Alternatives 10.4% 0.0% +10.4%
Cash 1.5% 0.0% +1.5%
Unassigned 3.7% 0.0% +3.7%


Holdings-Based Style Allocations as of December 31, 2023
Style IEF Actual (%) IEF Benchmark (%) Difference (%)
Large Cap (>$20Bil) 53.4% 68.8% -15.4%
Mid Cap ($5Bil - $20Bil) 20.4% 17.3% +3.1%
Small Cap (<$5Bil) 14.6% 13.9% +0.7%
Cash (equitized) 1.4% 0.0% +1.4%
Alternatives 10.2% 0.0% +10.2%
Unassigned 0.0% 0.0% +0.0%


Characteristics

Characteristics as of December 31, 2023
  IEF1 IEF Benchmark
Wgt. Mkt. Cap ($MM) $76,800 $79,655
Price/Earnings 17.93 11.41
Price to Book 2.39 1.68
Dividend Yield2 2.58% 2.99%
Holdings IEF Holdings  

1 Reflects the portion of the fund portfolio that is invested in public equities and REITs.

2 Does not reflect the deduction of fees.


Risk Characteristics as of December 31, 2023
Statistics (trailing 5 years) IEF IEF Benchmark
Beta 1.03 1.00
R-Squared 0.98 1.00

Top 10 Stock Holdings as of December 31, 2023
Company Country Fund % % of IEF Benchmark
Taiwan Semiconductor Manufacturing Taiwan 2.20% 1.63%
ASML Holding NV Netherlands 1.42% 1.04%
Samsung Electronics Co. South Korea 1.18% 1.00%
MercadoLibre, Inc. Argentina 0.98% 0.00%
Alibaba Group Holding Ltd. China 0.87% 0.54%
AIA Group Limited Hong Kong 0.81% 0.34%
Tencent Holdings Ltd. China 0.79% 0.86%
L'Oreal S.A. France 0.78% 0.41%
Novo Nordisk A/S Denmark 0.70% 1.16%
HDFC Bank Ltd. India 0.68% 0.20%

Risks & Disclosures

All investments carry some degree of risk that will affect the value of the Fund’s holdings, its investment performance and the price of its units. As a result, loss of money is a risk of investing in the Fund. IEF is subject to the following principal investment risks: market risk, investment style risk, security-specific risk, country risk, currency risk, derivatives risk and liquidity risk.

The performance shown is for the stated time period only and computed in U.S. Dollars (USD). Historical returns are not indicative of future performance. For further discussion of the Fund’s investments strategies and risks, please refer to the Investment Funds Description – P Series. This is not an offer to purchase securities.

Lending of Portfolio Securities

The Fund seeks to earn additional income by lending a portion of its portfolio securities to brokers, dealers and other financial institutions. The loans are secured at all times by cash and liquid high-grade debt obligations. As with any extension of credit, there are risks of delay in recovery and in some cases even loss of rights in the collateral should the borrower fail financially. In addition, losses could result from the reinvestment of the cash collateral received on loaned securities.

Valuation of IEF Units

In the daily valuation of IEF Units, Wespath uses a valuation methodology to capture changes in non-U.S. securities values that arise because of time-zone differences among global securities markets. Many non U.S. securities trade on exchanges that close several hours before IEF’s closing unit price is calculated in the United States, generally at 4 p.m. Eastern time. In the hours between the close of the non U.S. markets and the close of the U.S. market, the value of the non U.S. securities may change due to a variety of factors including, for example, company-specific announcements or market-wide developments. IEF’s daily return may diverge from the daily return of its benchmark index, in part, because the benchmark index values do not reflect such price adjustments.


Expense Ratio

The expense ratio is a measure of the annual fund operating expenses paid by the Fund expressed as a percentage of the average fair value of the Fund’s assets for the applicable year. The annual fund operating expenses consist of fees paid to subadvisor(s), and the Fund’s pro rata portion of custody fees and administrative and overhead expenses incurred by the overall Wespath Benefits and Investments organization in connection with providing investment, operating and administrative support to the Fund and the other funds available through Wespath Benefits and Investments, and for non-Fund related activities and operations.

The Fund’s actual annual fund operating expenses and the related expense ratio can differ from year to year. Actual annual fund operating expenses may vary depending on, among other things, market events, Fund size, transaction costs, timing of Fund inflows and outflows, and applicable internal costs and third-party fees. 2023 Expense Ratios reflect a recent change to the fee calculation methodology. The methodology for calculating the funds’ Administrative and Overhead Expenses—one component of overall Expense Ratios—was changed (effective July 1, 2023) to better align with the level of resources required by Wespath to administer each P Series fund. This methodology is applicable for the entire year beginning January 1, 2024.

The Fund may also pay transaction costs, performance fees, interest expenses, taxes and fees on uninvested cash held in sweep accounts, which are in addition to the annual fund operating expenses. The annual fund operating expenses and these additional expenses are reflected in the Fund’s unit price and reduce the Fund’s rate of return. For further information about the Fund’s fees and expenses, including the fee calculation methodology change, please refer to the Investment Funds Description – P Series.