IEF
International Equity Fund

Frank Holsteen
Managing Director, Investment Management

Hoa Quach, CFA
Director, Public Markets

Andrew Steedman, CFA
Associate, Public Equities

Amy Bulger
Director, Private Markets
| Fund Snapshot | |
| Inception | December 31, 1997 |
| Exp. Ratio | 0.68% for 2025 |
| Benchmark | MSCI All Country World ex-USA |
| Fund Assets | $4,121 Million as of December 31, 2025 |
| Holdings | December 31, 2025 |
| Unit Price History | Wespath Funds Price History |
| For More Information | Investment Funds Description – P Series |
| 3 mo | YTD | 1 yr | 3 yr | 5 yr | 10 yr | |
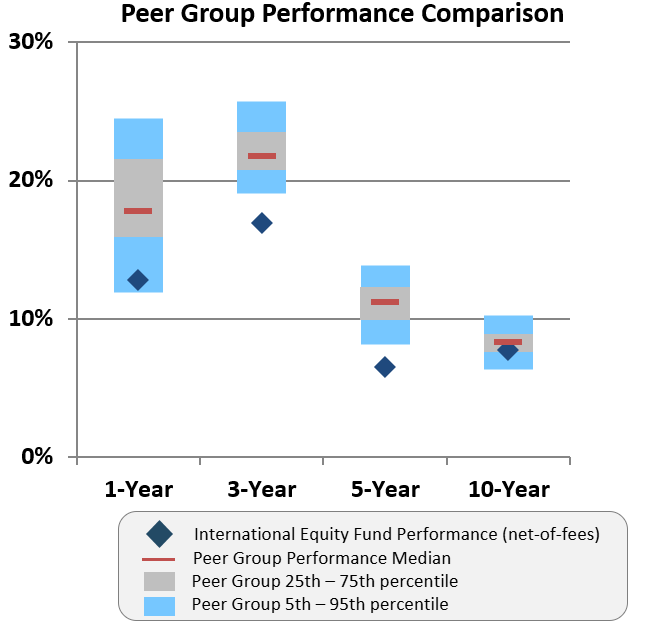
| International Equity Fund | 2.71% | 25.81% | 25.81% | 12.85% | 3.44% | 7.79% |
| IEF Benchmark | 4.76% | 31.96% | 31.96% | 17.10% | 7.77% | 8.37% |
International Equity Fund vs. Peer Group Universe