Fixed Income Fund - P Series
SELECT FUND (choose from dropdown)
- Extended Term Fixed Income Fund – P Series (ETFIF-P)
- Fixed Income Fund – P Series (FIF-P)
- Inflation Protection Fund – P Series (IPF-P)
- International Equity Fund – P Series (IEF-P)
- Multiple Asset Fund – P Series (MAF-P)
- Short Term Investment Fund – P Series (STIF-P)
- Social Values Choice Bond Fund – P Series (SVCBF-P)
- Social Values Choice Equity Fund – P Series (SVCEF-P)
- Stable Value Fund – P Series (SVF-P)
- U.S. Equity Fund – P Series (USEF-P)
- U.S. Equity Index Fund – P Series (USEIF-P)
- U.S. Treasury Inflation Protection Fund – P Series (USTPF-P)
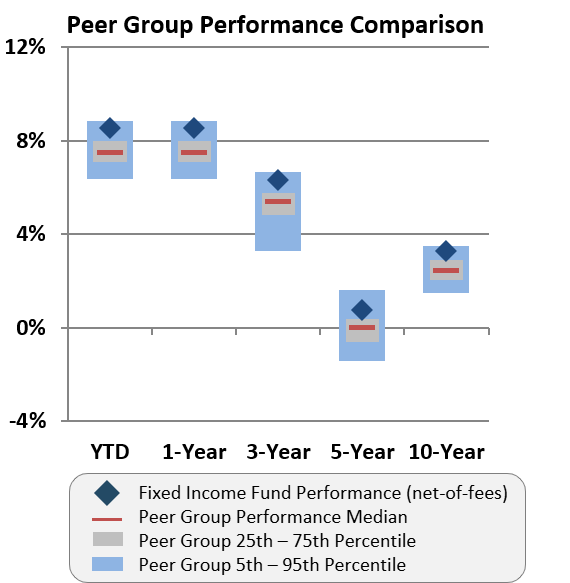
Fixed Income Fund – P Series (FIF-P)
FIF-F invests in a broadly diversified portfolio of fixed income securities, and alternative investments. The fund may also hold mortgages and other loans originated through the Positive Social Purpose Lending Program.
FIF-P seeks to earn current income while preserving capital by primarily investing in a diversified mix of fixed income securities.
FIF-P may invest in passive, enhanced passive and active investment strategies.
Fund Snapshot
| Items | Fund Snapshot |
|---|---|
| Inception | |
| Expense Ratio | |
| Fund Assets | |
| Holdings | |
| P Series Price History | |
| Investment Funds Description - P Series |
| Fund Snapshot | Data |
|---|---|
| Inception | December 31, 1997 |
| Expense Ratio | 0.47% as of December 31, 2025* |
| Fund Assets | $4,958 Million as of March 31, 2026 |
| Holdings | Holdings as of December 31, 2025 |
| P Series Price History | P Series Price History |
| Investment Funds Description - P Series | Investment Funds Description - P Series |
Fund Managers
External Asset Managers


The above individuals are responsible for the selection and monitoring of external investment manager(s).
*The expense ratio is a measure of the annual fund operating expenses paid by the fund expressed as a percentage of the average fair value of the fund’s assets for the applicable year. The annual fund operating expenses information set forth above is based on actual asset balances and fees and expenses, as of December 31, 2025. The fund’s actual annual fund operating expenses and the related expense ratio can differ from year to year. Actual annual fund operating expenses may vary depending on, among other things, market events, fund size, transaction costs, timing of fund inflows and outflows, and applicable internal costs and third-party fees. In addition to the annual fund operating expenses, the fund will pay transaction costs, any performance fees including carried interest (collectively, “performance fees”), interest expenses, taxes and fees on uninvested cash held in the sweep account. The annual fund operating expenses and these additional expenses are reflected in the fund’s unit value and reduce the fund’s rate of return. Please see the “Fees and Expenses of the Funds” section of the Investment Funds Description – P Series for further information about the fund’s fees and expenses.