FIF
Fixed Income Fund

Frank Holsteen
Managing Director, Investment Management

Hoa Quach, CFA
Director, Public Markets

Connie Christian, CFA
Manager, Fixed Income
| Fund Snapshot | |
| Inception | December 31, 1997 |
| Exp. Ratio | 0.47% for 2025 |
| Benchmark | Bloomberg U.S. Aggregate |
| Fund Assets | $4,972 Million as of December 31, 2025 |
| Holdings | December 31, 2025 |
| Unit Price History | Wespath Funds Price History |
| For More Information | Investment Funds Description – P Series |
| 3 mo | YTD | 1 yr | 3 yr | 5 yr | 10 yr | |
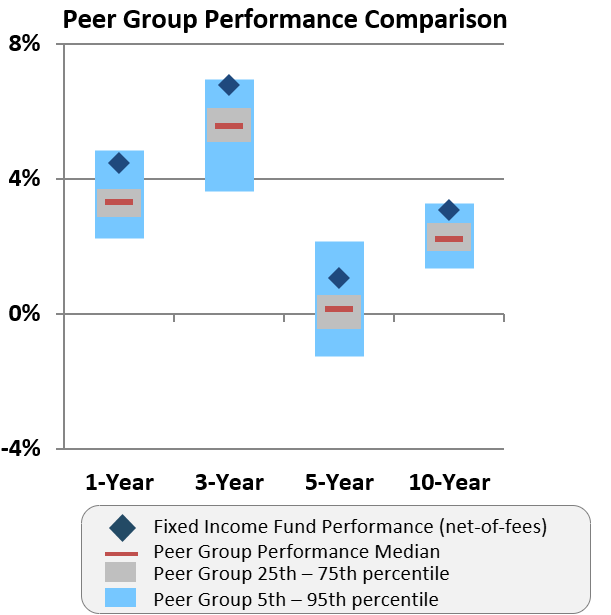
| Fixed Income Fund | 1.30% | 8.54% | 8.54% | 6.33% | 0.76% | 3.29% |
| FIF Benchmark | 1.10% | 7.34% | 7.34% | 5.35% | 0.04% | 2.70% |
Fixed Income Fund vs. Peer Group Universe