USEF
U.S. Equity Fund

Frank Holsteen
Managing Director, Investment Management

Hoa Quach, CFA
Director, Public Markets

Virgilio Calahong, CAIA
Manager, Public Equities

Amy Bulger
Director, Private Markets
| Fund Snapshot | |
| Inception | December 31, 1997 |
| Exp. Ratio | 0.57% for 2024 |
| Benchmark | Russell 3000™ Index |
| Fund Assets | $5,283 Million as of December 31, 2024 |
| Holdings | May 31, 2025 |
| Unit Price History | Wespath Funds Price History |
| For More Information | Investment Funds Description – P Series |
| 3 mo | YTD | 1 yr | 3 yr | 5 yr | 10 yr | |
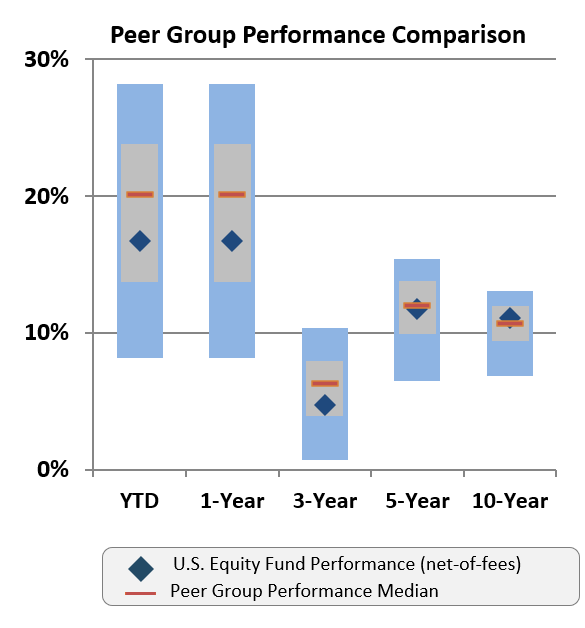
| U.S. Equity Fund | 8.01% | 3.25% | 10.68% | 14.90% | 12.91% | 11.16% |
| USEF Benchmark | 10.99% | 5.75% | 15.30% | 19.08% | 15.96% | 12.96% |
U.S. Equity Fund vs. Peer Group Universe