Investment Insights Blog: Are the Magnificent 7 Stocks Creating a New Dot-Com Bubble?

By Joe Halwax, CAIA, CIMA
Managing Director, Institutional Investment Services
For the past 18 months it’s been nearly impossible to turn on CNBC or read The Wall Street Journal without a mention of the “Magnificent Seven” (M7) stocks: Alphabet, Amazon, Apple, Meta, Microsoft, Nvidia and Tesla. Alongside inflation and interest rates, the strong performance of the M7 has emerged as one of the post-COVID era’s most compelling investment storylines.
These stocks are all associated with the continued growth of technology—especially the potential for mass adoption of artificial intelligence (AI), the next great technology shift of our generation. Given the M7’s recent performance, there are comparisons being made to other technology booms, including the internet and dot-com stock bubble of the late 1990s which infamously preceded the market crash of the early 2000s.
But are we really seeing a new dot-com bubble—one that could similarly pull down the rest of the market? Let’s take a closer look.
The Fifth Major Technology Shift of the Last 30 Years
Technology shifts are both exciting and volatile. Norms are broken, efficiencies are created, and in the past few decades, enormous companies have been created. Over the last four technological shifts—the adoption of the PC, the internet, mobile computing and cloud computing—Wall Street has consistently underestimated the growth and impact of these technologies:
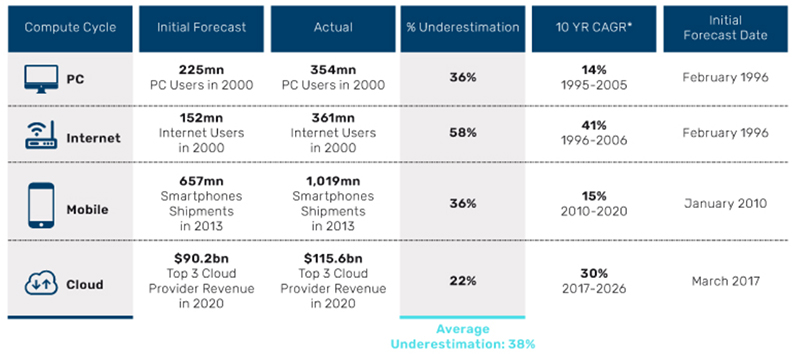
The potential uses and revenue streams of AI are impossible to predict—other than they will likely be enormous. The M7 are all seen as AI plays covering a range of themes, from Microsoft in software and large language models to Nvidia in hardware.
Remembering the Dot-Com Era
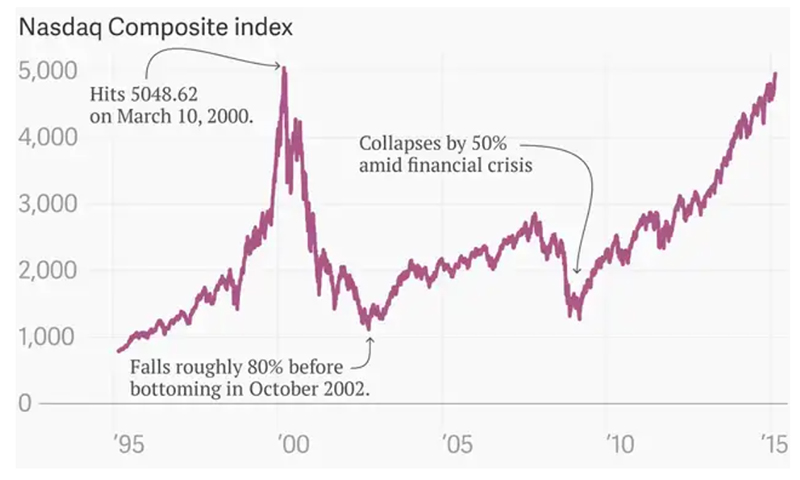
The dot-com bubble refers to the rapid rise of the U.S. technology stocks associated with the technology shift of the internet in the 1990s. The tech-heavy NASDAQ index saw a fivefold rise from 1995 to 2000. Then, from its peak on March 10, 2000, the index fell 77% before hitting a low on October 4, 2002. Many of the now famous names like Pets.com and eToys.com went bust, while blue chip technology companies like Cisco, Intel and Oracle lost more than 80% of their value. The NASDAQ did not return to its early 2000 high for another 15 years. This was a phenomenon that was truly felt at a market-wide level.
Comparing the Dot-Com and Magnificent 7 Eras
It’s easy to understand why today’s M7 trend reminds some investors of the dot-com era. But there are important differences, too. While we can’t capture all the comparisons, here are some characteristics to keep in mind:
| Similarities | Differences |
| Momentum: Stocks within the technology sector rose rapidly | Quality: M7 stocks are generating strong earnings, revenue and free cash flow |
| Excitement: Extreme optimism about technology shifts fueled investor behavior, with significant allocations to the sector by retail investors | Valuations: Notable dot-com stocks were roughly twice as expensive, measured by forward P/E, compared to the M7 of 2024 |
| Concentration: The “Four Horsemen” of the 1990s (Microsoft, Cisco, Dell and Intel) accounted for 50%-60% of the late-90s NASDAQ gains, similar to the M7 today | Track Records: The M7 are generally well-established companies with strong moats, not fads |
| Interest rates: The Fed Funds Rate in December 1999 was 5.3%, roughly the same as it is today | Cash: The M7 generate a lot of cash and reinvest approximately 60% of cash flow into growth and R&D, which is much more than many of the dot-com era names |
| Monetary policy: Central banks were easing interest rates in 1997-1998 prior to the dot-com surge, while the M7 have soared despite monetary tightening |
Now, let’s return to our original question—are we really seeing a new dot-com bubble?
My answer: There are some striking similarities, and there’s still time for markets to show the irrational exuberance of the dot-com era, but there are enough key differences to where I don’t think we’re there just yet.
Of course, we should note that bubbles are only seen from the vantage point of history. We don’t actually know if we’re in a bubble until it has burst. Here’s where a magical crystal ball would be helpful!
We know the intrinsic value of a company is based on what investors are willing to pay today for the expectations of future opportunities. In the dot-com era, one of the reasons for the eventual crash was that earnings growth slowed and fell well below expectations. If we had a crystal ball and could see the cash flows of the M7 up to 100 years into the future, there would be less debate on the appropriate price for their stocks.
The challenge today is we can’t value the future size of the AI market and the other challenges and opportunities the M7 will face. Business customers today are shifting spending to prioritize AI, which is a boon for the M7 right now, but the same was true of telecom/internet-related spending in the dot-com era. For example, we can assume other chip makers will try to cut into the very high margins of Nvidia, so the future of this AI boom is still ripe with uncertainty for the M7.
So far the fundamentals of the M7 have remained strong, satisfying investor expectations, but if those earnings and growth rates collapsed or sky-high profit margins declined, we could see a bubble-like response in stock prices. Let’s not forget that these seven stocks have seen some wide swings recently, too. Just a couple years ago the M7 were significant laggards:
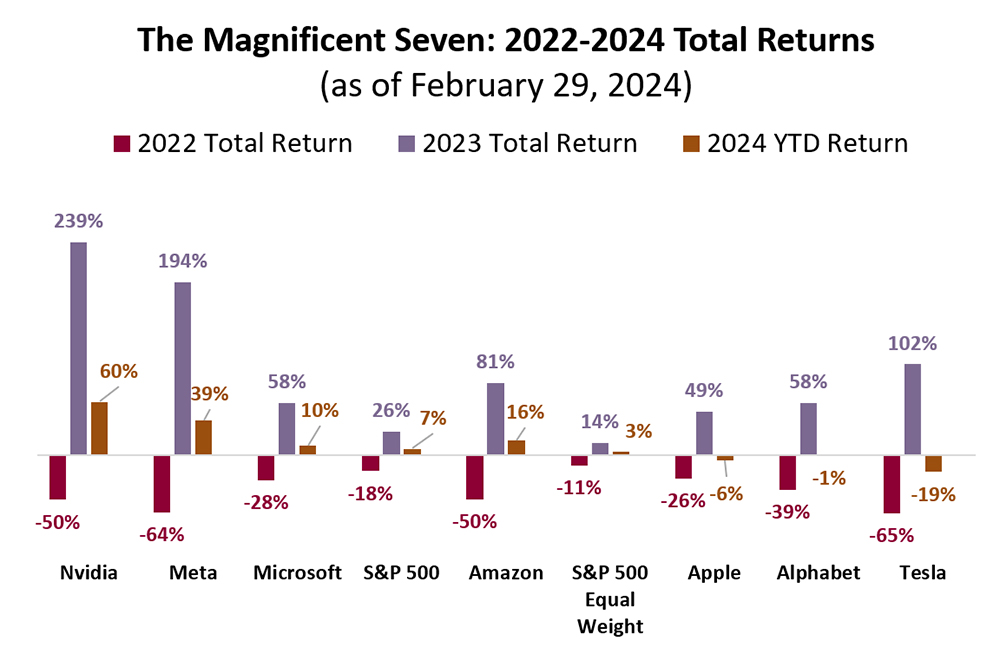
(Source: Wespath, FactSet)
It’s also difficult to predict whether sluggishness in the M7 would permeate other stocks as well. That’s why it’s always important to consider diversification and all the risks/opportunities outside the M7.
The Other Ones
For those interested in traditional valuation metrics, currently the M7 stocks have a forward price-to-earnings ratio of roughly 35 while the rest of the S&P 500 is closer to 16. There are clearly some opportunities to find value in the rest of the market as other stocks play catch up, or if the momentum of the M7 starts to slow. Even broadening your lens to next 42-largest companies is interesting:
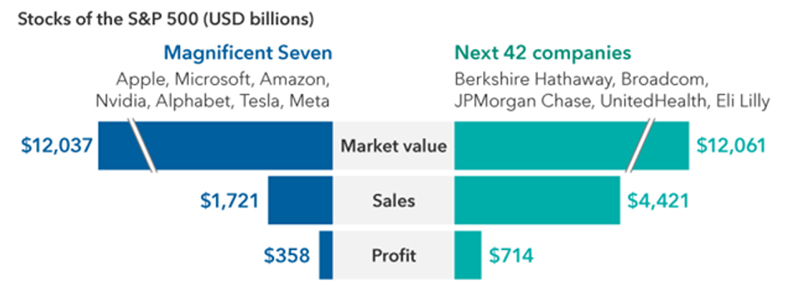
Investors clearly have high expectations for the M7 compared with the next 42 companies as both groups are collectively valued the same by the market. Yet, the next 42 companies have 2.5x the sales and 2x the profit. If the M7 can continue to deliver rapid growth in sales and maintain current levels of profitability, then their lofty valuations will be proven to be justified. If not, investors still have plenty of opportunity to earn decent returns from stocks outside the M7.